Hit Counter Code

Wednesday, January 26, 2011

Fault Tree Analysis (FTA)

This is one of the 'Advanced Tools' for Problem Solving.
A Fault Tree Analysis in one of its simplest forms is shown in the following example.
In that, any of the following failures will cause the system to fail:

•Failure of components 1 and 2.

•Failure of components 3 and 4.

•Failure of components 1 and 5 and 4.

•Failure of components 2 and 5 and 3.


- Adapted from http://www.weibull.com/basics/fault-tree/index.htm
Hit Counter Code

Monday, January 24, 2011

Process Decision Programme Chart (PDPC)

The Process Decision Program Chart (often just called PDPC) is a very simple tool with an unnecessarily impressive sounding name, possibly derived from the Japanese name, from where it came as one of the '7 Management Tools’.
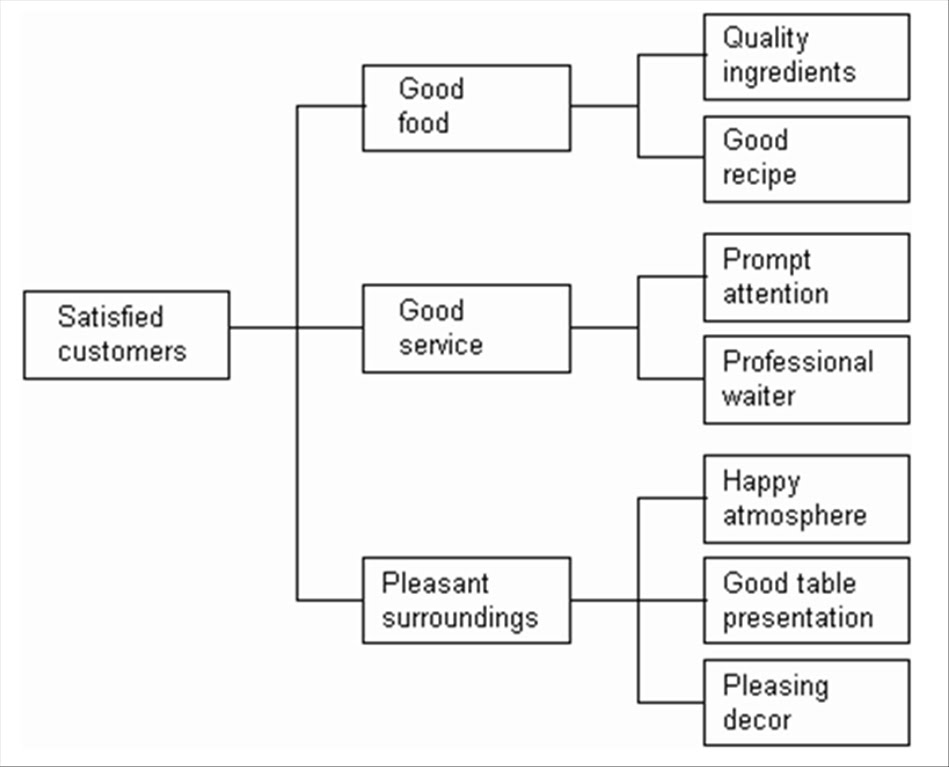
A useful way of planning is to break down tasks into a hierarchy, using a Tree Diagram. PDPC simply extends this chart a couple of levels to identify risks and countermeasures for the bottom level tasks, as in the diagram below. Different shaped boxes are used to highlight the risks and and countermeasures (they are often shown as 'clouds' to indicate their uncertain nature).
Using PDPC is using a little rigour to identify possible problems and countermeasure in each area before diving into action.


1. Break down the task into a Tree Diagram. The bottom 'leaves' on the tree will now indicate the actual tasks to be carried out.
2. For each bottom-level task 'leaf', brainstorm or otherwise identify a list of possible problems that could occur.
3. Select one or a few of the risks identified in step 2 to put on the diagram, based on a combination of probability of the risk occuring and the potential impact, should the risk materialise.
4. For each risk selected in step, brainstorm or otherwise identify possible countermeasures that you could take to minimise the effect of the risk.
5. Select a practical subset of countermeasures identified in step 4 to put on the chart.
6. Continue building the chart as above, finding risks and countermeasures for each task. If there are a large number of tasks, you can simplify the task by only doing this for tasks that are considered to be at risk or where the impact of their failure would be alarge.

- Adapted from http://syque.com/quality_tools/tools/TOOLS12.htm

Saturday, January 22, 2011

Arrow Diagram

This is another of the ‘7 Management Tools’ and is used to show the sequence of a series of operations and the relationship among them. It makes the mind clear about the system and enables thought on improvements that can be initiated in the operations and their likely consequences on subsequent stages.
For ease of identity, the stages in the following sample diagram are shown in numbers; in an actual arrow diagram, the numbers would be replaced by the specific name of the operation.


Friday, January 14, 2011

Affinity Diagrams

Affinity Diagrams, another of the ‘7 Management Tools’ is used when a number of apparently unconnected points are raised for achieving an objective. One way of approach to form the Affinity Diagram (or the KJ diagram, named after Jiro Kawakita) is for different persons posting their opinions regarding the contributory aspects on to a board in Post-it slips and then organizing those of similar affinity under suitable headings.
The following example illustrates an Affinity Diagram for finding out “Features required for an improved Digital Camera” (from http://www.baran-systems.com/)

Tuesday, January 11, 2011

Matrix Data Analysis Method

Where to use Matrix Data Analysis Method which is another of the '7 Management Tools' in Problem Solving?
We use it when investigating factors which affect a number of different items, to determine common relationships.
We use it to determine whether or not logically similar items also have similar factor effects.
We use it to find groups of logically different items which have similar factor effects.
The example given below illustrates how a pharmaceutical combine examined the pain-killing drugs of its subsidiaries in terms of the cost to product and general efficacy.

Products which are high cost but are not of highest efficacy, viz C and D, are dropped. Low-cost drug of reasonable efficacy, i.e. E is promoted, and high-cost drugs have a project initiated to reduce production cost - in the case of A and B .

Thursday, January 6, 2011

Matrix Diagram

Matrix Diagram is another under the '7 Management Tools'. It is used when relationship between elements are known and it enables that to be seen at one glance.

A Sample of the Matrix Diagram is given below. It illustrates the relation between the technical aspects of a television set and the perception of the effect by the user.


Monday, January 3, 2011

Relations Diagram

This is the second one listed among the '7 Management Tools'.
It is used when causes and effects are very much inter-related, as in the following case illustrating a funds crunch situation in an industry.

Saturday, January 1, 2011

Tree Diagram

The earlier blog "Problem Solving Tools" has listed the various systems used and the Tree Diagram is shown as one of the '7 Management Tools'.
A sample of the Tree Diagram is reproduced below, showing the trunk, branches and leaves of a figurative tree. It is taken from the following site: http://www.syque.com/quality_tools/toolbook/Tree/example.htm


It illustrates how the method was used in improving the performance of a restaurant.
The points shown in the 'leaves' (of the 'tree') were used for collecting the performance data, setting of higher targets and improving the operation of restaurant.