Hit Counter Code

Saturday, February 15, 2014

HOLOCRACY

An Extreme Take on Restructuring: No Job Titles, No Managers, No Politics
It's true with a lot of conflicts at work in general — what looks like interpersonal conflicts are often conflicts of organizational "roles" with competing goals. Because the two are fused in conventional organization, those conflicts are seen as interpersonal, and politics is often just a covert way of going about them.
Holacracy is a distributed authority system – a set of “rules of the game” that bake empowerment into the core of the organization. Unlike conventional top-down or progressive bottom-up approaches, it integrates the benefits of both without relying on parental heroic leaders. Everyone becomes a leader of their roles and a follower of others’, processing tensions with real authority and real responsibility, through dynamic governance and transparent operations
Governance clarity enables most work to get done by clear roles using clear authority, outside of painful meetings and group consensus-seeking. On the ground, a team’s operational flow is synchronized by regular Tactical Meetings that facilitate rapid-fire triage of key issues. Anything in the way of getting the work done gets identified and processed into clear next-actions and target outcomes. In Tactical Meetings:
·         Every agenda item gets processed every meeting, on-time every-time
·         The focus is on next-actions, not endless analysis
·         Metrics are surfaced and checklists are reviewed – quickly
·         No one hides – radical transparency shows all progress, or lack thereof
Holacracy is a real-world-tested social technology for agile and purposeful organization. It radically changes how an organization is structured, how decisions are made, and how power is distributed. Holacracy leads to...
Lean & Adaptable Organization: Dynamic steering applied to organizational design. The process focuses on minimally sufficient improvements, to address concrete tensions and move forward.
Highly Effective Meetings: Different meeting processes for Operations & Governance guarantee a rigorous focus on the work. The result: clear outcomes, no waste of time, no ego domination.
Clearly Distributed Authority: Managers are no longer needed, the leadership function is now distributed. The result: faster, more appropriate decisions by more engaged and autonomous workers.
Purpose Driven Work: Beyond stakeholders and shareholders, Purpose is the bottom line of holacratic organizations. And it's not just talk: the purpose is structurally reflected in everyday work
Tactical Meeting Process 
Check-in Round Goal:  Notice what’s got your attention, call it out, let it go.  Sacred space: no cross-talk. Get present, here and now; grounds the meeting.  
Checklist Review Goal:  Bring transparency to recurring actions. Facilitator reads checklist of recurring actions by role; participants respond "check" or "no- check" to each for the preceding period (e.g. the prior week).
Metrics Review Goal:  Build a picture of current reality. Each role assigned a metric reports on it briefly, highlighting the latest data.
Project Updates Goal:  Track updates to key projects of the circle.  The Facilitator reads each project on the circle’s project board and asks: “Any updates?” The project’s owner either responds “no updates” or shares what has changed since the last meeting. Questions allowed, but no discussion.
Agenda Building Goal:  Build an agenda with placeholder headlines.  Build agenda of tensions to process; one or two words per item, no discussion.
Triage Issues Goal:  Get through all agenda items in the allotted time. To Resolve Each Agenda Item:
1. Facilitator asks:  “What do you need?”
2. Agenda item owner engages others as-needed
3. Capture any next-actions or projects requested & accepted
4. Facilitator asks:  “Did you get what you need?”    
Closing Round Goal:  Harvest learning from the meeting.  Each person can share a closing reflection about the meeting; no discussion.
This past November, the CEO of Zappos, the successful online shoe retailer, called the company’s employees together for an all-hands meeting and made an extraordinary announcement: Zappos would become a “holocracy”, to achieve full-on holocracy-hood by December 2014. Instead of the customer-focused yet relatively conventional hierarchy, he was revamping the organization into a new structure with no job titles and no managers, in which all work is done in circles.

-          Sally Helgesen in S+b and http://holacracy.org/how-it-works

Monday, February 3, 2014

Swim-Lane Diagrams

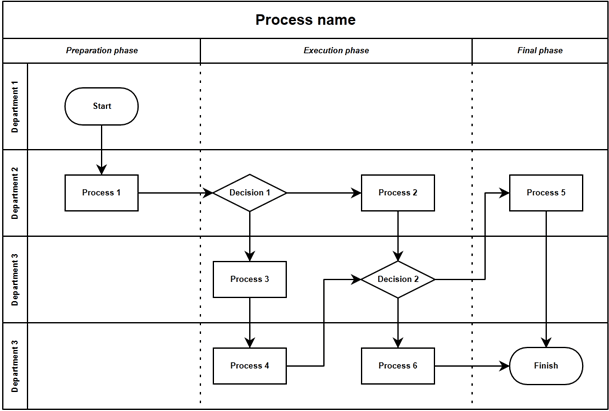
Swim Lane (also called Rummler-Brache) Diagrams are process flow diagrams which also trace the interconnections between processes, departments and teams.
This approach focuses on the interconnections between departments and teams, and helps you spot more clearly issues and possible improvements you can make with the system.
Here is a simple manufacturing example showing what the swim lane diagram for the manufacturing process can look like the following:

Once the diagram is complete, it is easy to see who is responsible for what and it is also easy to start identifying potential inefficiencies. The diagram technique helps you break down your process so you can spot the bottlenecks, redundancies, and other causes of inefficiency, and so get on with improving your business process.
Creating and Using Rummler-Brache Diagrams
The first step to spotting inefficiencies and making improvements is to break down your organization's processes into manageable level of detail.
If you are trying to find strategic inefficiencies, then analyzing every process in detail is unnecessary and cumbersome. Here you might assign each main functional area to a swim lane and look at the interchanges in and between them. This would help you spot disconnects between functional areas of the business.
If you were trying to diagnose inefficiencies in your hiring and recruitment process then you would look at specific roles, departments and perhaps some key individuals and assign these to the swim lanes.
For a comprehensive approach, you may start by analyzing the processes and organization using high level swim lane diagrams. Then, once you have spotted areas you need to focus on, you can drill down there using more detail diagrams.
List the participants in the far left column of the diagram. Assign each of these participants to a horizontal band (swim lane). It is helpful to assign the swim lanes in sequence, with the first column assigned to the participant who provides the first input. (For customer facing processes, this is often the customer.)
List the step or activities required at each stage of the process. Follow through the process sequentially. Remember you are mapping how the process is currently being done – not how you think it should be done. The key to creating a useful diagram is to keep it as simple as possible. Try not to include too many loop backs (unless you are focusing on exceptions) – and keep the process mapping moving forward.
Analyze the diagram for potential areas of improvement. Are there any gaps or steps missing? Is there duplication? Are there overlaps, where several people or teams perform the same task or activity? Are there activities that add no value?
Once you have identified potential areas for improvement, the next step is to decide how to address the issues and make changes. Rummel-Brache diagrams can also be used at this stage to map out the proposed process changes. As with any proposed changes in the organization, the pros and cons need to be analyzed, and any change that follow must be carefully planned.
For example, if you are considering removing duplicate processes, you must first look at whether there is a legitimate need and also what would be the impact of removing the duplication.

-          - See more at: http://www.mindtools.com/pages/article/newTMC_89.htm#sthash.Qm6UWpTi.dpuf

Tuesday, June 18, 2013

Sure Questions in ISO Audit

No one can predict all of the questions that an auditor will ask, but you can bet that that following five will be among them. Be prepared to answer these queries from your auditor:
What is your quality (or environmental, safety, information security) policy? This is a basic question and one that is very likely to take center stage during the audit. The focus on this question subsides during periodic audits, primarily because the organization’s management system matures, and the same auditor often assesses one company multiple times.
Intent behind the question: Ascertain whether the organization has done a good enough job communicating the policy to its employees, and that they have internalized the organization’s perspective regarding quality. 
Best Response: Employees know where to find the quality policy and are able to articulate in their own words what the policy means to them and how it affects their work, as well as their appreciation and understanding of quality. 
What are your objectives? This is a question that applies to everyone, not just managers. It is expected that objectives are represented with data and charts, but not absolutely required. Intent behind the question: Ascertain whether the company has goals it wants to achieve and that it measures and tracks process or product performance, as a whole or individually by department or employee. 
Best response: Employees know where to find the quality objectives, and they understand exactly why they have been established and what their purpose is. They know what the desired goal is and how to tell whether it has been achieved. They know how to initiate corrective action when the desired state is not achieved. 
Where do you get your procedures from? Procedures or documents in general are an integral part of ISO-compliant management systems; you need them to ensure processes are in control. Therefore, questions regarding documents are definitely going to appear throughout the audit. 
Intent behind the question: Ascertain whether employees follow standard processes frequently as part of their jobs, regardless of whether those processes are documented in a formal, written procedure or not. If there are written procedures or other documents, it is also important to determine whether employees can easily find any documents related to their jobs. 
Best response: Employees know where to find the procedures that apply to their jobs, can obtain them quickly, can speak about them, and feel invested in the procedure as well as the process. 
What do you do if you find a nonconformance or a potential improvement? The whole concept of continual improvement is paramount to ISO standards, and the auditor will try to assess it over and over. The auditor will ask for at least the basic concepts of continual improvement. 
Intent behind the question: Ascertain whether employees understand the concepts of nonconformance, continual improvement, and corrective and preventive actions, and whether they understand the systems that have been put in place to handle them. 
Best response: Employees know when to use a nonconformance report and when to use a corrective action or preventive action. They actually have issued some in the past, have been assigned nonconformance reports to dis-position, or have been tasked with conducting root cause analyses for corrective or preventive actions. 
What are your responsibilities? This is a broad question and can lead to many answers. Employees may refer to procedures, job descrip-tions, objectives, etc. 
Intent behind the question: Ascertain whether employees are aware of their responsibilities and their roles in the overall success of the quality (or environmental, safety, information security) management system. 
Best response: Employees know what their responsibilities are and understand their importance to the success of the management system. They know where their responsibilities have been defined and documented, and have agreed to them in writing. 
- From “ISO Audit: Five Not-So-Easy Questions”by Miriam Boudreaux in QualityDigest.com

Sunday, June 9, 2013

A new look at 5S in the Office

The lean tool 5S was conceived and developed in a manufacturing environment. It is a very effective tool at eliminating some of the most senseless and aggravating sources of wasted time and energy. It only makes sense that we would all make the next logical leap and attempt to put the same practice to work in our office environment. However, most attempts tried to follow exactly the same practice we learned on the manufacturing floor. So we organize our cubicle or office room the 5S way but we didn’t save any noticeable time or eliminate any waste.
That is because our cubicle work surface is not where we work. It is where we sit, and where we put reference materials, but our work takes place on our computer systems. It is the digital system of files, software tools, and communication pathways that we must 5S if we want to experience real results.
Looking back, “5S” stands for:
• Sort—organize and throw away what is not important
• Set—make limits and establish a place for everything
• Shine—make sure everything is in working order and ready for use
• Standardize—establish standard practices so that the other “S’s” become easier and keeping up with the system becomes automatic
• Sustain—make it an everyday habit to do the above; don’t let things lose their readiness
The power of 5S is that it effectively eliminates the waste associated with not having the right tools or information handy when we need them. To get an idea, just think about your day today. How much time have you wasted so far searching through emails for one particular message, digging through electronic files for information, or battling with software that wasn’t set up right or wasn’t available? Most of us spend a great deal of our day just looking for things we need to do our job. 5S addresses that.
So, we figured out that we need 5S applied to our business intranet more than to our desktops. But there are still many mistakes we can make that will sabotage our efforts, and no one has put out any guidelines to direct us around them. Let’s consider a few that are common so we can avoid those at least.
Don’t make arbitrary decisions, or arbitrarily follow directions, about locating or moving files or tools
One of the biggest lean or 5S disasters that can befall the office environment is to arbitrarily start moving files around. Unfortunately, it’s also one of the easiest mistakes to make.
It sometimes happens when an improvement team is overeager to organize and doesn’t consider how the files got where they are, who accesses them, or what connections might be broken if they are moved. Usually, though, at least one person on a team has the sense to stop the madness and point out the potential folly. 
Most often, we walk into work one day to find all our files gone when a manager who does not use the files dictates that all of a certain group or type of file be relocated to a specific drive or folder. This occurs when that manager perceives that the 5S expectations for the digital system aren’t manifesting, and that manager decides to force the issue.
The problem we create when we just move a file is the sundering of every existing memory, habit, digital link, reference, or pointer to that file. If the file is important, we should assume, because it is usually true, that someone, a group, or a function has links or pointers to that file. If those links and pointers are part of an enterprise resource planning (ERP) system, we probably just ruined a great deal of work and a great many reference links within the system.
Moving files is easy. Figuring out why hundreds of people are angry, wasting time, or why a carefully configured system is no longer functional is hard. Putting everything back together is also hard.
Imagine the chaos if some of those files, drawings, specifications, or regulations are shared with other design centers, suppliers, or test centers outside of your organization. When their links are broken, how much time and energy will your teams spend trying to fix that problem? What kind of delays will occur in your chain while everyone waits? What kind of penalties or expedite fees might that incur?
Before moving any files, be very careful to ascertain who uses or needs those files, and be proactive about communicating a change or updating links before making the move. It’s the easiest and costliest mistake to make, but one that is also easily avoided by asking some questions we should be asking anyway.


Standardize very little to standardize easily

One of the easiest ways to practically standardize the use of file folders across many functions or responsibilities throughout the organization is not to dictate how file folders will be organized, but instead to standardize how everyone will explain how the folders are organized. Standardize how, not what.
There is no way that any team can possibly predict the best way that any other team’s information and folder structures—or their own for that matter—can most efficiently be organized. Determining a good or excellent organization requires substantial experimentation. Add on the problem of arbitrary reorganization, as mentioned above, and you can see that it takes time and careful thought to figure out how things are “best.”
So don’t try to predict it and dictate it. Instead, insist that every functional folder make a text document the very first file in the top-level folder. If the document name begins with multiple zeros, 000FileRules or 0000Folder5S, it will very likely be the first one in the order by default. That text document shall contain that function’s rules and guidelines for how the folders within are organized and named.
When everyone is accustomed to the standard of finding and reading the rules at the top of the top folder, there is no excuse for anyone to break from the rules. There is also no excuse, if the rules are clear, for anyone to be unable to find the information he needs, even if it is in another group’s folder structure.

Think long-term use, not short-term easy

The behavior that most sabotages the 5S philosophy toward digital information is the one by which we keep all of our developing information in a project folder. Sure, during the project, only the project team needs the information, but when the project is over, the people who want or need the information often had little or nothing to do with the project.
So when we go looking for test data, or supplier agreements, or process capability studies, we have no idea what project folder to look in. No one remembers, two years after the product launch, that the XB99 product was developed by a project code named Fairy Dust. And even if we do ask everyone we know and dig through old, archived project folders to find it, we don’t know where in the folder to look. Is it in the engineer’s folder, or the test lab’s folder, or the project manager’s folder?
Get out of the habit of keeping project folders. Or, limit project folders to correspondence records only. Instead of doing what is easiest during the project, make a habit of planning for what data will be needed, by whom, and where, after the project is over.
Instead of associating everything with a project, associate it with that part of the business that will live beyond the project and to which the information truly belongs. In product development environments, that association is to the product.
When the project begins, open an information file structure for a new product in the system, detailing how and where it will forever reside. Associate or link important information that should persist after the project is complete to that product.
Eventually some switch will be triggered to identify the product as “released,” meaning it is in production. When that happens, permission will be required to make changes to associated information, but prior to that event, it should be just as easy for team members to update information in the final system as it is in a project folder.
The habit of putting the information, in the beginning, where it should live in the end, automates the 5S behavior for us. It also gets everyone in the habit of knowing exactly where and how to look for information they need, either during the project, or years after product launch.

Limit: one

The second “S” for “set” has two meanings. One is to establish a place where your tools or information should always be found. The second is to set limits on how many there are in that location. When talking inventoried components, tools, or supplies, this makes sense. When we are talking about information, especially any form of documentation that could be used for or against us in a liability suit, tax audit, contractual disagreement, or policy or instructions, there should ever be only one.
One copy of any “official” information is prudent. One copy of any piece of any kind of information is smart and efficient. As soon as there are two copies, it becomes nearly impossible for anyone to be sure she is looking at the correct one.
Make it a sin to copy information. Make it mandatory to review, comment, edit, or redline information in-place. Otherwise we create uncountable mistakes, redos, confusion, duplicated work, and disagreements. We risk corrupting or losing information when we copy information.


- Condensed from “5S Your Digital Workspace, Carefully” by Alan Nicol in Qualitydigest.com

Sunday, March 11, 2012

Happiness at Work

If you're unhappy at work--or anywhere else, for that matter--it's because you've made yourself unhappy. There's an easy way to change that.

I once knew a saleswoman–young, divorced–who got a diagnosis of breast cancer. She had to work and raise two kids while fighting the cancer. Even so, she managed to be happy at work, noticeably happier than her co-workers. In fact, she not only won her battle with cancer but subsequently became one of the top salespeople at Bristol Myers.

She was not, as it happens, naturally cheerful. Quite the contrary. When she started full-time work, she was frequently depressed. But she turned it around.

That saleswoman once told me: When you're unhappy, it's because you've decided to be unhappy.

Maybe it wasn't a conscious decision; maybe it crept up on you while you weren't looking–but it was a decision nonetheless. And that's good news, because you can decide instead to be happy. You just need to understand how and why you make the decisions.

What Are Your Rules?

Happiness and unhappiness (in work and in life) result entirely from the rules in your head that you use to evaluate events. Those rules determine what's worth focusing on, and how you react to what you focus on. Many people have rules that make it very difficult for them to happy and very easy for them to be miserable.

I once worked with a sales guy who was always angry at the people he worked with. The moment anything didn't go the way he thought it should go, he'd be screaming in somebody's face. He was making everyone around him miserable–but just as importantly, he was making himself miserable, because just about anything set him off. For this guy, the everyday nonsense that goes on in every workplace was not just important, but crazy-making important.

I once asked him what made him happy. His answer: "The only thing that makes this !$%$#! job worthwhile is when I win a $1 million contract." I asked him how often that happened. His response: "About once a year." In other words, this guy had internal rules that guaranteed he'd be miserable on a day-to-day basis, but only happy once a year.

One of the other sales guys at that firm had the exact opposite set of rules. His philosophy was "every day above ground is a good day." When he encountered setbacks, he shrugged them off – because, according to his internal rules, they just weren't that important. When I asked him what made him miserable, he said: "When somebody I love dies." In other words, the second sales guy had rules that made it easy for him to be happy but difficult to be miserable.

Make Yourself Happier: 3 Steps

1. Document Your Current Rules: Set aside a half-hour of alone time and, being as honest as you can, write down the answers to these two questions:

·                  What has to happen for me to be happy?

·                  What has to happen for me to be unhappy?

Now examine those rules. Have you made it easier to miserable than to be happy? If so, your plan is probably working.

2. Create a Better Set of Rules: Using your imagination, create and record a new set of rules that would make it easy for you to be happy and difficult to be miserable. Examples:

·                  "I enjoy seeing the people I work with each day."

·                  "I really hate it when natural disasters destroy my home."

Don't worry whether or not these new rules seem "realistic"–that's not the point. All internal rules are arbitrary, anyway. Just write rules that would make you happier if you really believed them.

3. Post the New Rules Where You'll See Them: When you've completed your set of "new" rules, print out them out and post copies in three places: your bathroom mirror, the dashboard of your car, and the side of your computer screen. Leave them up, even after you've memorized them.

Having those new rules visible when you're doing other things gradually re-programs your mind to believe the new rules. You will be happy at work. It's really that simple.

- From “Insider newsletter” by Geoffrey James LLC

Thursday, September 22, 2011

Role Model?

To be honest, I don’t care that Steve Jobs resigned.
Millions do, though, and the announcement sparked considerable praise regarding his vision, his strategy, and his leadership abilities. To most people he is an iconic figure worthy of emulation, although some do argue that Jobs is a terrible role model.
What kind of role model is Jobs? Or Vijay Mallya? Or Indra Nooyi? Who cares. Doesn’t matter. You and I, we don’t need a role model.
Kapil Dev, the cricket icon, would agree.
But we need role models — the more the better.
Apparently Jobs paid incredible attention to detail, drove outstanding results, ignored critics when he felt he was right, etc. All admirable qualities. Yet he also may not have been the most, um, sensitive and compassionate leader.
So do you want to be like Steve Jobs? Yes. And no.
That’s why looking for one role model doesn’t work. No matter how wonderful, people are still people, brilliance and flaws and talents and peccadilloes and all. Some traits are worthy of emulation, others are not.
So forget finding a role model. Instead look to different people for specific qualities or skills you want to emulate. Never start with a person; start with the talent or trait. Break attributes down into specifics, the narrower the better.
For example, I admire how the writer Arundhati Roy quickly establishes a scene and creates a mood. I admire how Salman Rushdie seamlessly blends information with story to foster understanding. I admire Winston Churchill’s wit and gift for phrasing. I can’t write like any of them — far from it. And I shouldn’t want to; I should be me, not them. But, if establishing a mood is critical, I can think, “How would Khushwant Singh handle this…?” drawing on his skills for guidance and inspiration.
And in the process hopefully become an even better me.
The same is true with speaking. When I speak I’m pretty casual. But at times, to make a complex point, I need to be more formal. Shiv Kherra is exceptional at marshaling facts, research, and examples to craft solid arguments. I can’t speak as well as Deepak Chopra — far from it — but I can draw on one aspect of his considerable skills to be a more effective speaker.
I can list lots more examples. I’ve been writing them down for years. Whenever I see someone do something well, I write it down. My list ranges all the way from the waitress who dealt with an overbearing customer to the CEO who handled an employee meeting that turned violent to Azim Premji’s knack for thinking about marketing as an integral part of creating substance.
You run into people who excel at something all the time, so you start your own list. Just don’t focus on the person, because you don’t want to be like them. Instead you just want to do something, usually a very specific something, the way they do.
If having a role model can help you be more successful, why not have dozens of role models? Then you can still be you and use your role models to be an even better you.

- Adapted from “Forget About Finding a Role Model” by Jeff Haden, a prolific writer of management books


Friday, September 9, 2011

Ten Presentation Probelms


REASON #10: It is all data, no story!

·          Diagnosis: You presented scads of information without any context or meaning.

·          Why you did it: You wrongly assumed a presentation was the same thing as a lecture.

·          What resulted: The audience pulled out their Blackberries when you clicked your fifth slide.

·          How to fix it: Make your presentation tell a story, ideally with the audience as the heroes.

REASON #9: Your slides are too fancy!

·          Diagnosis: You filled your slides with special effects and visual jim-cracks.

·          Why you did it: You were afraid that the audience would find you boring.

·          What resulted: Your audience watched the pretty pictures and missed what you were saying.

·          How to fix it: Use the minimum visuals that you need to tell the story.

REASON #8: Your slide background is too busy!

·          Diagnosis: You used a background template that was busy and obtrusive.

·          Why you did it: You wrongly thought it would make your slides look more “professional.”

·          What resulted: Your audience got headaches trying to see what was actually on each slide.

·          How to fix it: Use a simple, single color background. Always.

hREASON #7: Your fonts are unreadable!

·          Diagnosis: You used fonts that were too fancy or too small or both.

·          Why you did it: The fonts looked great on your computer; on the projector… not so much.

·          What resulted: The audience squinted and peered, and then gave up. Blackberry time!

·          How to fix it: Use large fonts in simple faces (like Ariel); avoid boldface, italics and UPPERCASE

REASON #6: Your graphics are too complex!

·          Diagnosis: You inserted giant, complicated graphics with lots of little details.

·          Why you did it: One picture is worth a thousand words, right? (Uh, wrong.)

·          What resulted: Your audience stared glassy-eyed, then pulled out their Blackberries.

·          How to fix it: Only include simple graphics; highlight the data point that’s important

REASON #5: You are all opinion, no fact!

·          Diagnosis: You expressed all sorts of opinions without any supporting data.

·          Why you did it: Laziness. It’s easy to claim “leadership”; it’s harder to actually be a leader.

·          What resulted: Your credibility with the audience leaped right down the toilet.

·          How to fix it: Only state opinions that you can back up with quantifiable data.

REASON #4: You speak fluent biz-blab!

·          Diagnosis: Your presentation was filled with tacky business buzzwords.

·          Why you did it: You wrongly thought the biz-blab made you sound “business-like.”

·          What resulted: Your audience thought you were pompous, crazy, and/or talking in tongues.

·          How to fix it: Just stop it. Cold turkey. Please

REASON #3: You drifted off topic!

·          Diagnosis: You included data and anecdotes that didn’t reinforce your message.

·          Why you did it: You didn’t bother to figure out what would really interest your audience.

·          What resulted: Your audience lost your train of thought and you lost credibility.

·          How to fix it: Only include material that’s relevant to your overall message

REASON #2: It was too d**n long!

·          Diagnosis: You presented way more than anybody wanted to know.

·          Why you did it: You were “spraying and praying” that something that would pique their interest.

·          What resulted: Zzzzzzzzzzzzzzzzz…

·          How to fix it: Always make your presentation less than half as long as you think it should be.

REASON #1: You read from your slides!

·          Diagnosis: You stood there like an idiot and read aloud what everyone could read for themselves.

·          Why you did it: You didn’t know the material so you needed your slides as a memory-jog.

·          What resulted: By your third slide, your audience was ready to strangle you.

·          How to fix it: Use slides to reinforce your message rather than to outline your data points.

-Adapted from Top 10 Reasons Your Presentation Sucks By Geoffrey James in Bnet.com

Tuesday, March 29, 2011

FMEA

Failure modes and effects analysis (FMEA) is a step-by-step approach for identifying all possible failures in a design, a manufacturing or assembly process, or a product or service.


“Failure modes” means the ways, or modes, in which something might fail. Failures are any errors or defects, especially ones that affect the customer, and can be potential or actual.

Failures are prioritized according to

1. How serious their consequences are,

2. How frequently they occur and

3. How easily they can be detected.


The purpose of the FMEA is to take actions to eliminate or reduce failures, starting with the highest-priority ones.

Failure modes and effects analysis also documents current knowledge and actions about the risks of failures, for use in continuous improvement. FMEA is used during design to prevent failures. Later it’s used for control, before and during ongoing operation of the process. Ideally, FMEA begins during the earliest conceptual stages of design and continues throughout the life of the product or service.

When to use FMEA

• When a process, product or service is being designed or redesigned, after quality function deployment.

• When an existing process, product or service is being applied in a new way.

• Before developing control plans for a new or modified process.

• When improvement goals are planned for an existing process, product or service.

• When analyzing failures of an existing process, product or service.

• Periodically throughout the life of the process, product or service

FMEA Procedure

1. Assemble a cross-functional team of people with diverse knowledge about the process, product or service and customer needs. Functions often included are: design, manufacturing, quality, testing, reliability, maintenance, purchasing (and suppliers), sales, marketing (and customers) and customer service.

2. Identify the scope of the FMEA. Is it for concept, system, design, process or service? What are the boundaries? How detailed should we be? Use flowcharts to identify the scope and to make sure every team member understands it in detail.

3. Fill in the identifying information at the top of your FMEA form.

4. Identify the functions of your scope. Ask, “What is the purpose of this system, design, process or service? What do our customers expect it to do?” Name it with a verb followed by a noun. Usually you will break the scope into separate subsystems, items, parts, assemblies or process steps and identify the function of each.

5. For each function, identify all the ways failure could happen. These are potential failure modes. If necessary, go back and rewrite the function with more detail to be sure the failure modes show a loss of that function.

6. For each failure mode, identify all the consequences on the system, related systems, process, related processes, product, service, customer or regulations. These are potential effects of failure. Ask, “What does the customer experience because of this failure? What happens when this failure occurs?”

7. Determine how serious each effect is. This is the severity rating, or S. Severity is usually rated on a scale from 1 to 10, where 1 is insignificant and 10 is catastrophic. If a failure mode has more than one effect, write on the FMEA table only the highest severity rating for that failure mode.

8. For each failure mode, determine all the potential root causes. Use tools classified as cause analysis tool, as well as the best knowledge and experience of the team. List all possible causes for each failure mode on the FMEA form.

9. For each cause, determine the occurrence rating, or O. This rating estimates the probability of failure occurring for that reason during the lifetime of your scope. Occurrence is usually rated on a scale from 1 to 10, where 1 is extremely unlikely and 10 is inevitable. On the FMEA table, list the occurrence rating for each cause.

10. For each cause, identify current process controls. These are tests, procedures or mechanisms that you now have in place to keep failures from reaching the customer. These controls might prevent the cause from happening, reduce the likelihood that it will happen or detect failure after the cause has already happened but before the customer is affected.

11. For each control, determine the detection rating, or D. This rating estimates how well the controls can detect either the cause or its failure mode after they have happened but before the customer is affected. Detection is usually rated on a scale from 1 to 10, where 1 means the control is absolutely certain to detect the problem and 10 means the control is certain not to detect the problem (or no control exists). On the FMEA table, list the detection rating for each cause.

12. Is this failure mode associated with a critical characteristic? (Critical characteristics are measurements or indicators that reflect safety or compliance with government regulations and need special controls.) If so, a column labeled “Classification” receives a Y or N to show whether special controls are needed. Usually, critical characteristics have a severity of 9 or 10 and occurrence and detection ratings above 3.

13. Calculate the risk priority number, or RPN, which equals S × O × D. Also calculate Criticality by multiplying severity by occurrence, S × O. These numbers provide guidance for ranking potential failures in the order they should be addressed.

14. Identify recommended actions. These actions may be design or process changes to lower severity or occurrence. They may be additional controls to improve detection. Also note who is responsible for the actions and target completion dates.

15. As actions are completed, note results and the date on the FMEA form. Also, note new S, O or D ratings and new RPNs.

- Extracted from ttp://asq.org/learn-about-quality/process-analysis-tools/overview/fmea.html