Swim Lane (also called
Rummler-Brache) Diagrams are process flow diagrams which also trace the
interconnections between processes, departments and teams.
This approach focuses on the
interconnections between departments and teams, and helps you spot more clearly
issues and possible improvements you can make with the system.
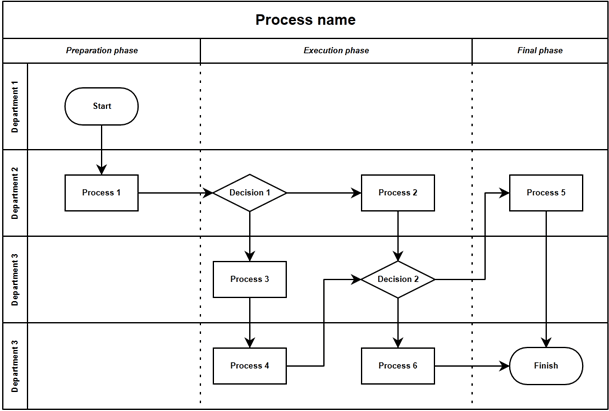
Here is a simple manufacturing
example showing what the swim lane diagram for the manufacturing process can
look like the following:
Once the diagram is complete, it is
easy to see who is responsible for what and it is also easy to start
identifying potential inefficiencies. The diagram technique helps you break
down your process so you can spot the bottlenecks, redundancies, and other
causes of inefficiency, and so get on with improving your business process.
Creating and Using Rummler-Brache
Diagrams
The first step to spotting
inefficiencies and making improvements is to break down your organization's
processes into manageable level of detail.
If you are trying to find strategic
inefficiencies, then analyzing every process in detail is unnecessary and
cumbersome. Here you might assign each main functional area to a swim lane and
look at the interchanges in and between them. This would help you spot
disconnects between functional areas of the business.
If you were trying to diagnose
inefficiencies in your hiring and recruitment process then you would look at
specific roles, departments and perhaps some key individuals and assign these
to the swim lanes.
For a comprehensive approach, you may
start by analyzing the processes and organization using high level swim lane
diagrams. Then, once you have spotted areas you need to focus on, you can drill
down there using more detail diagrams.
List the participants in the far left
column of the diagram. Assign each of these participants to a horizontal band
(swim lane). It is helpful to assign the swim lanes in sequence, with the first
column assigned to the participant who provides the first input. (For customer
facing processes, this is often the customer.)
List the
step or activities required at each stage of the process. Follow through the process sequentially. Remember you are mapping how
the process is currently being done – not how you think it should be done. The
key to creating a useful diagram is to keep it as simple as possible. Try not
to include too many loop backs (unless you are focusing on exceptions) – and
keep the process mapping moving forward.
Analyze the diagram for potential
areas of improvement. Are there any gaps or steps missing? Is there duplication?
Are there overlaps, where several people or teams perform the same task or
activity? Are there activities that add no value?
Once you have identified potential
areas for improvement, the next step is to decide how to address the issues and
make changes. Rummel-Brache diagrams can also be used at this stage to map out
the proposed process changes. As with any proposed changes in the organization,
the pros and cons need to be analyzed, and any change that follow must be
carefully planned.
For example, if you are considering
removing duplicate processes, you must first look at whether there is a
legitimate need and also what would be the impact of removing the duplication.
-
- See more at:
http://www.mindtools.com/pages/article/newTMC_89.htm#sthash.Qm6UWpTi.dpuf
No comments:
Post a Comment