
A sample of the Tree Diagram is reproduced below, showing the trunk, branches and leaves of a figurative tree. It is taken from the following site: http://www.syque.com/quality_tools/toolbook/Tree/example.htm
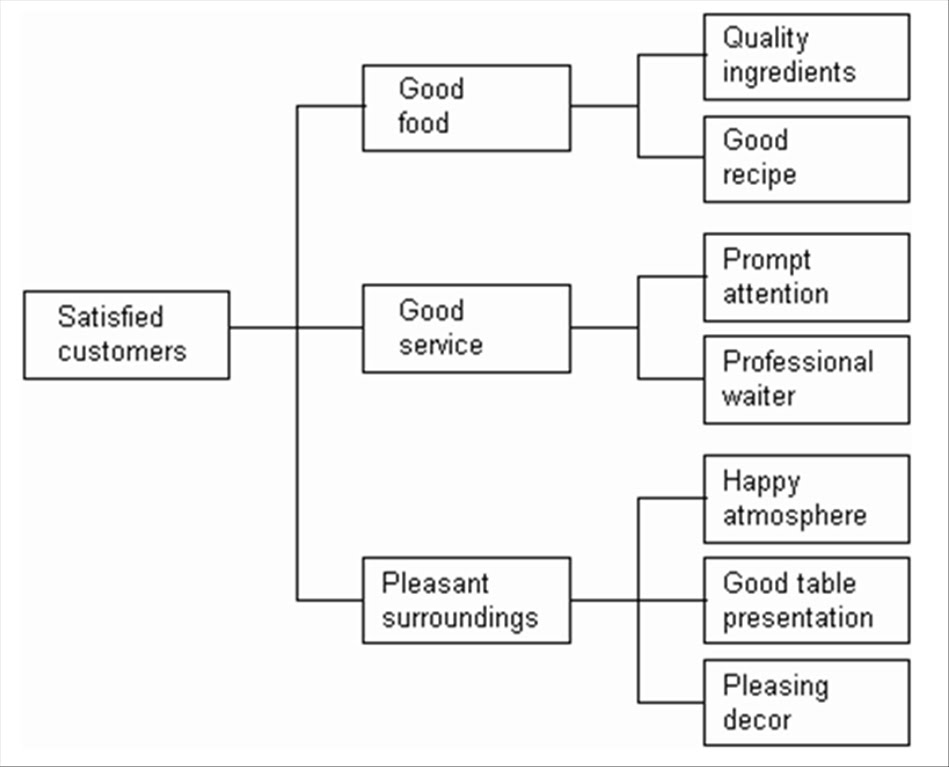
It illustrates how the method was used in improving the performance of a restaurant.
The points shown in the 'leaves' (of the 'tree') were used for collecting the performance data, setting of higher targets and improving the operation of restaurant.
No comments:
Post a Comment